Advanced Light Microscopy & Image Analysis Image Gallery
 [1]
[1]
Brain tissue
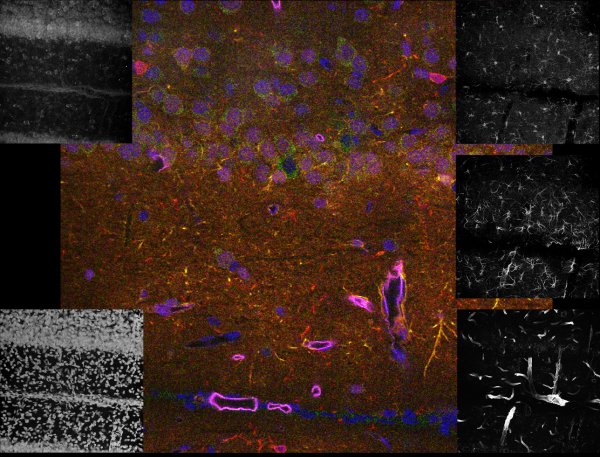
Our Leica microscope has the capability to spectrally separate, with dramatic clarity, some of the most challenging overlapping fluorophores. It was possible to generate the high-resolution 5 channel image to the left representing the 3-D distribution of five labels specific for 4 cell types and all nuclei. The black and white images around the edge are projection images from the individual channels. The color image is a single focal plane from the 3-D volume, where the individual channels were pseudo-colored and overlaid. The specimen was imaged with a 40X 1.3NA lens.
blue = cell nuclei, green = Nissl-specific for neurons, yellow = reactive astrocytes, red = microglia, purple = endothelial cells representing blood vessels
Specimen courtesy of Dr. B. Shain, imaging and processing by R. Cole
 [2]
[2]
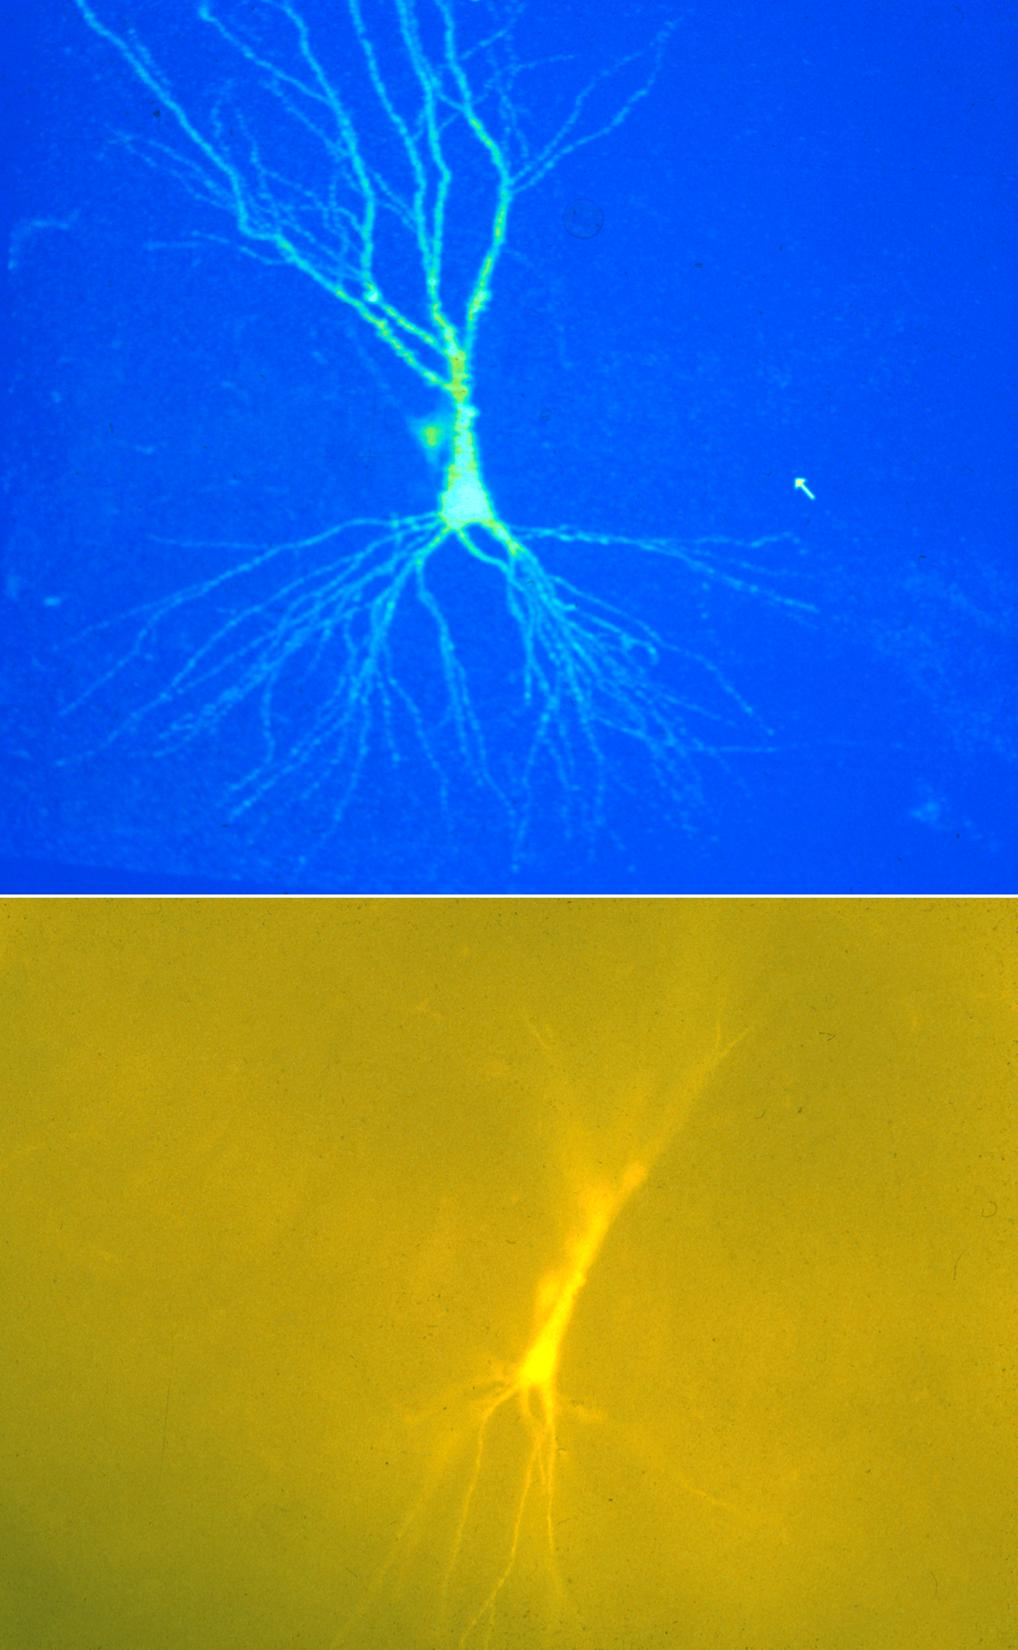
Wide field vs. Confocal microscopy
Comparison of bright field and second harmonic generation (SHG) imaging of isolated collagen fibers and mouse skin.
SHG is a nonlinear optical effect. Contrast is generated from variations in a specimen’s ability to generate second harmonic light from the incident light beam, usually a Ti-sapphire LASER.
SHG requires intense laser light passing through a material containing a noncentrosymmetric molecular structure. In order to generate contrast via SHG, the material must have a specific molecular orientation such that the frequency of incident light is doubled. Examples of biological materials which are polarizable and assemble into fairly ordered, large noncentrosymmetric structures are collagen, microtubules and muscle myosin.
 [3]
[3]
Confocal Image
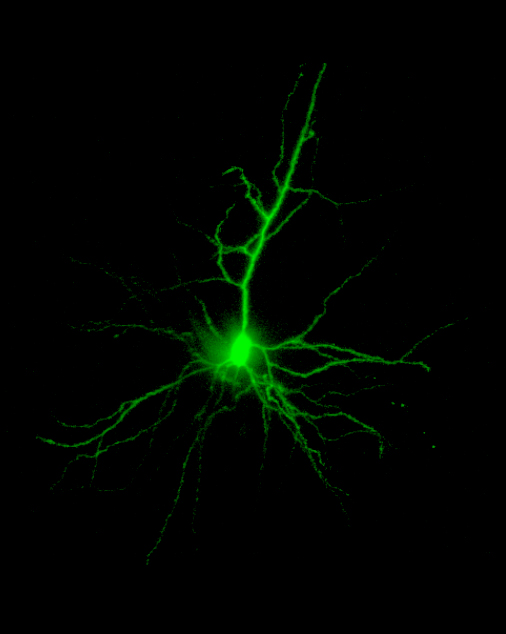
A neonatal rat pyramidal neuron filled with Lucifer Yellow imaged on the BioRad MRC600™ confocal microscope using a 20X oil objective, NA=0.8. Image size is 320 x 425 x 120 µm.
 [4]
[4]
Polarized Light Images
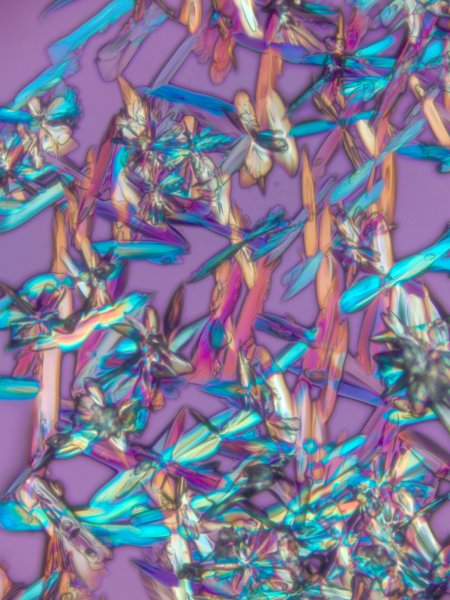
True-color polarized light image of different crystals. Polarized light microscopy can produce both qualitative and quantitative measurement from birefringent specimens (decomposition of a ray of light into two rays when passing through certain samples). These specimens can be alive, fixed or inanimate. The colors in the image are a result of the interference between light waves as they pass through the specimen.
 [5]
[5]
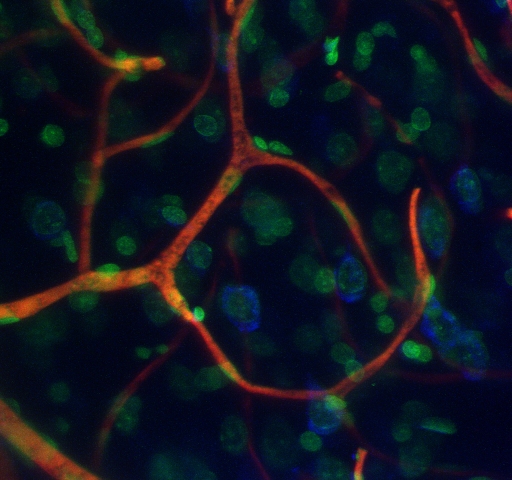
Triple-labeled vascular casting of rat cerebral cortex
This maximum intensity projection of a 3-D confocal-microscope-image stack displays cell nuclei in green, blood vessels in red, and (neuronal) Nissl substance in blue.
Courtesy of Chris Bjornsson of the Wadsworth Center
 [6]
[6]
Montaging & Sorting Image
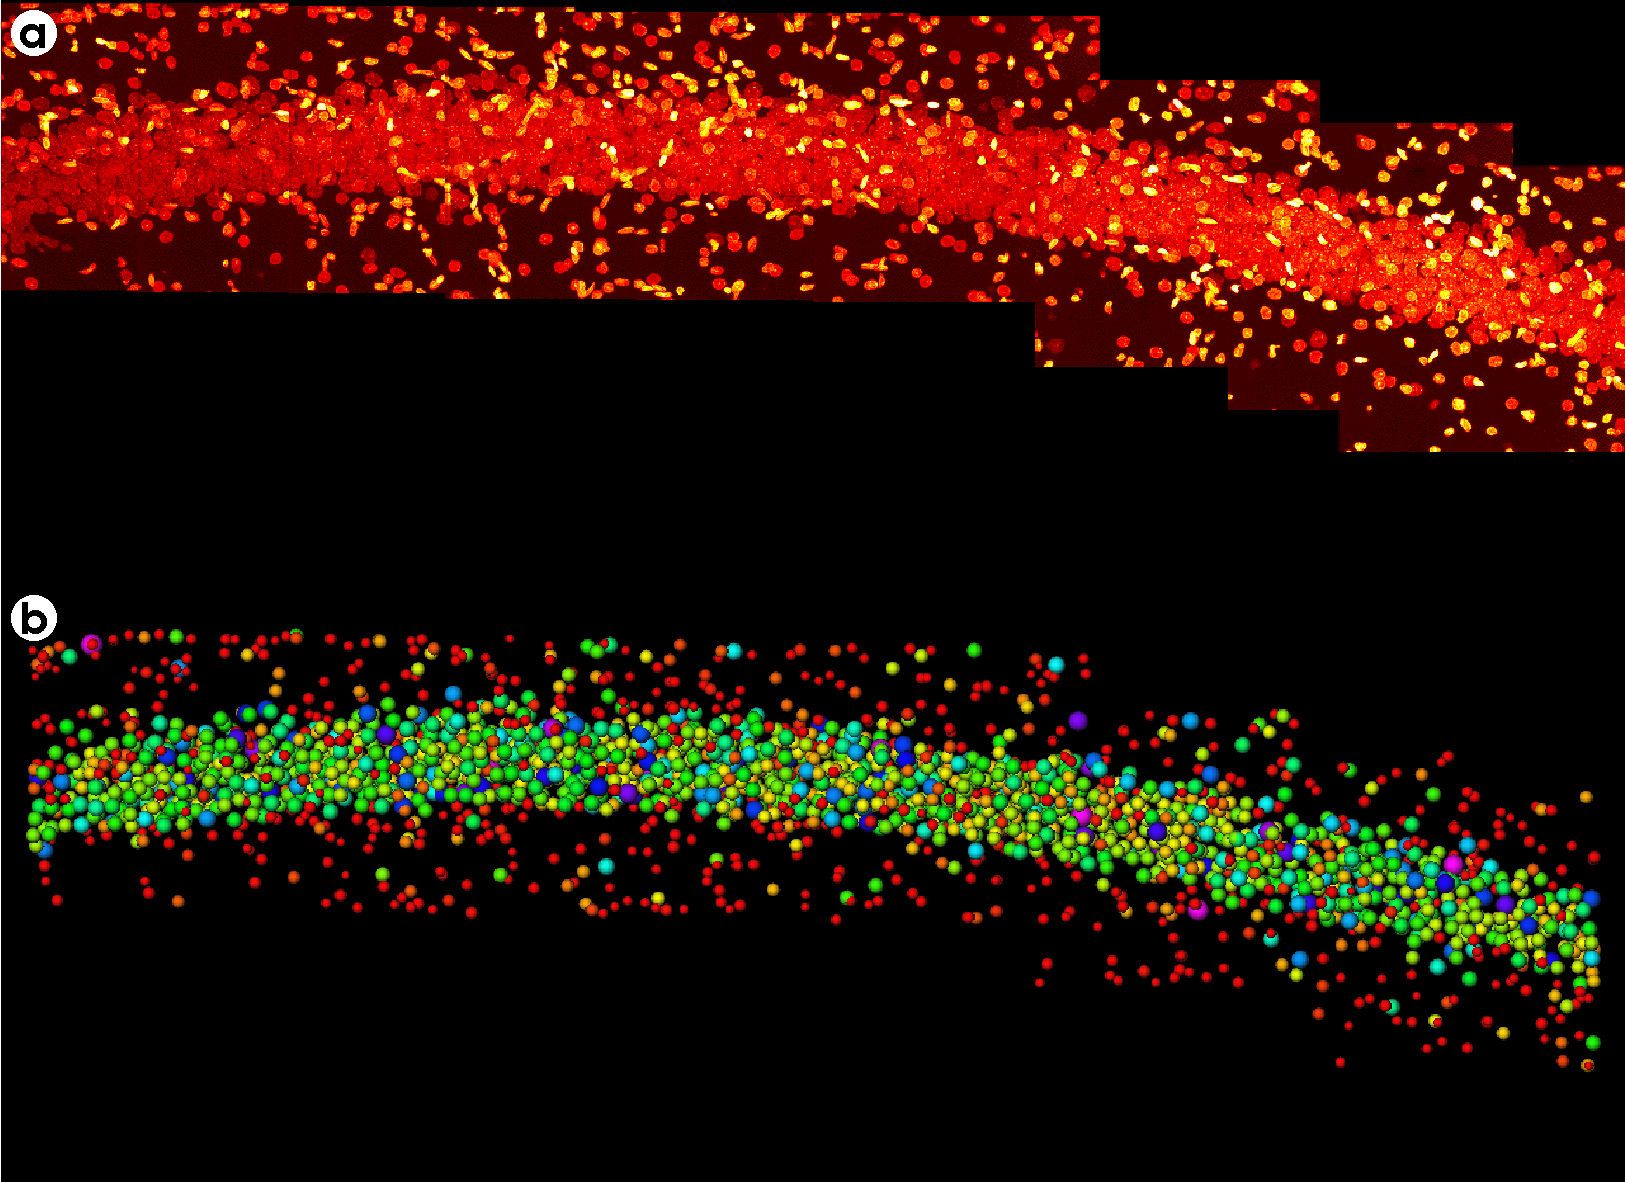
- A montage of twelve 3-D image fields recorded along the hippocampal pyramidal layer of a rat brain stained with acriflavine (a nuclear stain). Each field was collected on the BioRad™ confocal microscope using a 40X oil objective, NA=1.0. Image size for each field was 215 x 215 x 60 µm.
- The montage region with each nucleus was replaced with a sphere of equal volume and color coded depending on its size.
 [7]
[7]
Triple labeled PtK cells
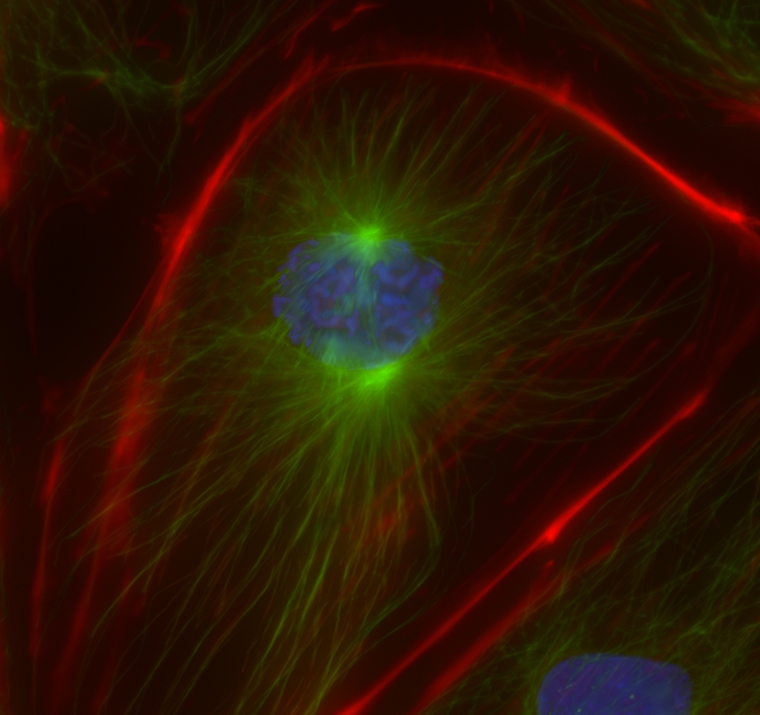
Maximum intensity projection in X/Y axis (62 slices, 0.2 µm step size) of a PtK cell stained for microtubules (green), and DNA (blue). The images were collected using a 60X objective (1.4 NA) on a Nikon TE2000 microscope equipped with filter wheels used for multi-dimensional imaging.
 [8]
[8]
Fixed Neuron
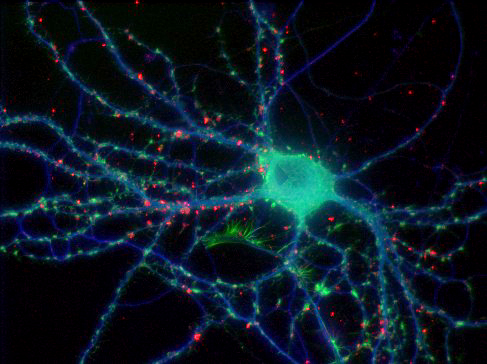
A multi-wavelength, three-dimensional, wide-field immunofluorescence image of a fixed neuron. The projection was generated using an extended depth of field algorithm. Cell body labeled for tubulin is shown in blue, F-actin in green, and presynaptic protein in red.
Specimen courtesy of Natalie Dowell-Mesfin, BMS-PhD student
 [9]
[9]
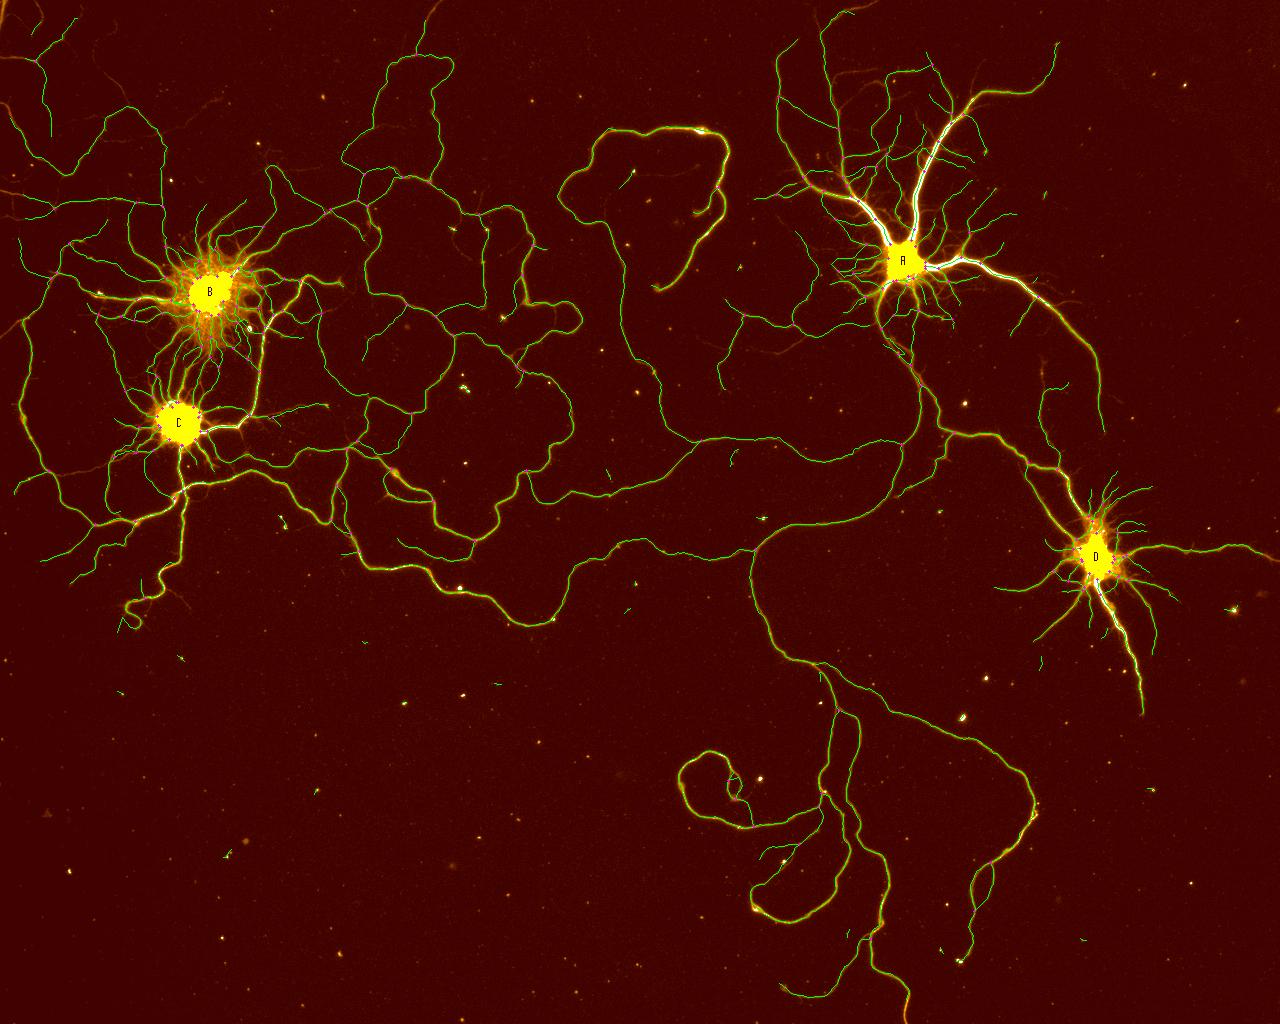
2D Tracing
An image of isolated rat, 18-day, embryonic, hippocampal neurons cultured for 7 days on smooth silicon surfaces. The neuronal processes were labeled for βIII-tubulin, imaged and then traced with the 2D tracing software. The yellow areas (lettered) are the cell soma and the green are the traced processes. The image was collected on the Olympus BX41WI epi-fluorescent microscope with an Optronics Magnafire CCD camera using a 20X NA=0.4 objective lens (field size = 577 x 462 µm).
 [10]
[10]
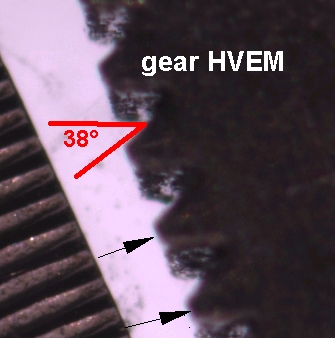
Macro Imaging
Image of a small gear, demonstrating both annotation and measurement capabilities of the software.
Courtesy of Mr. Steve Meyer, Wadsworth Center, Albany, NY
 [11]
[11]
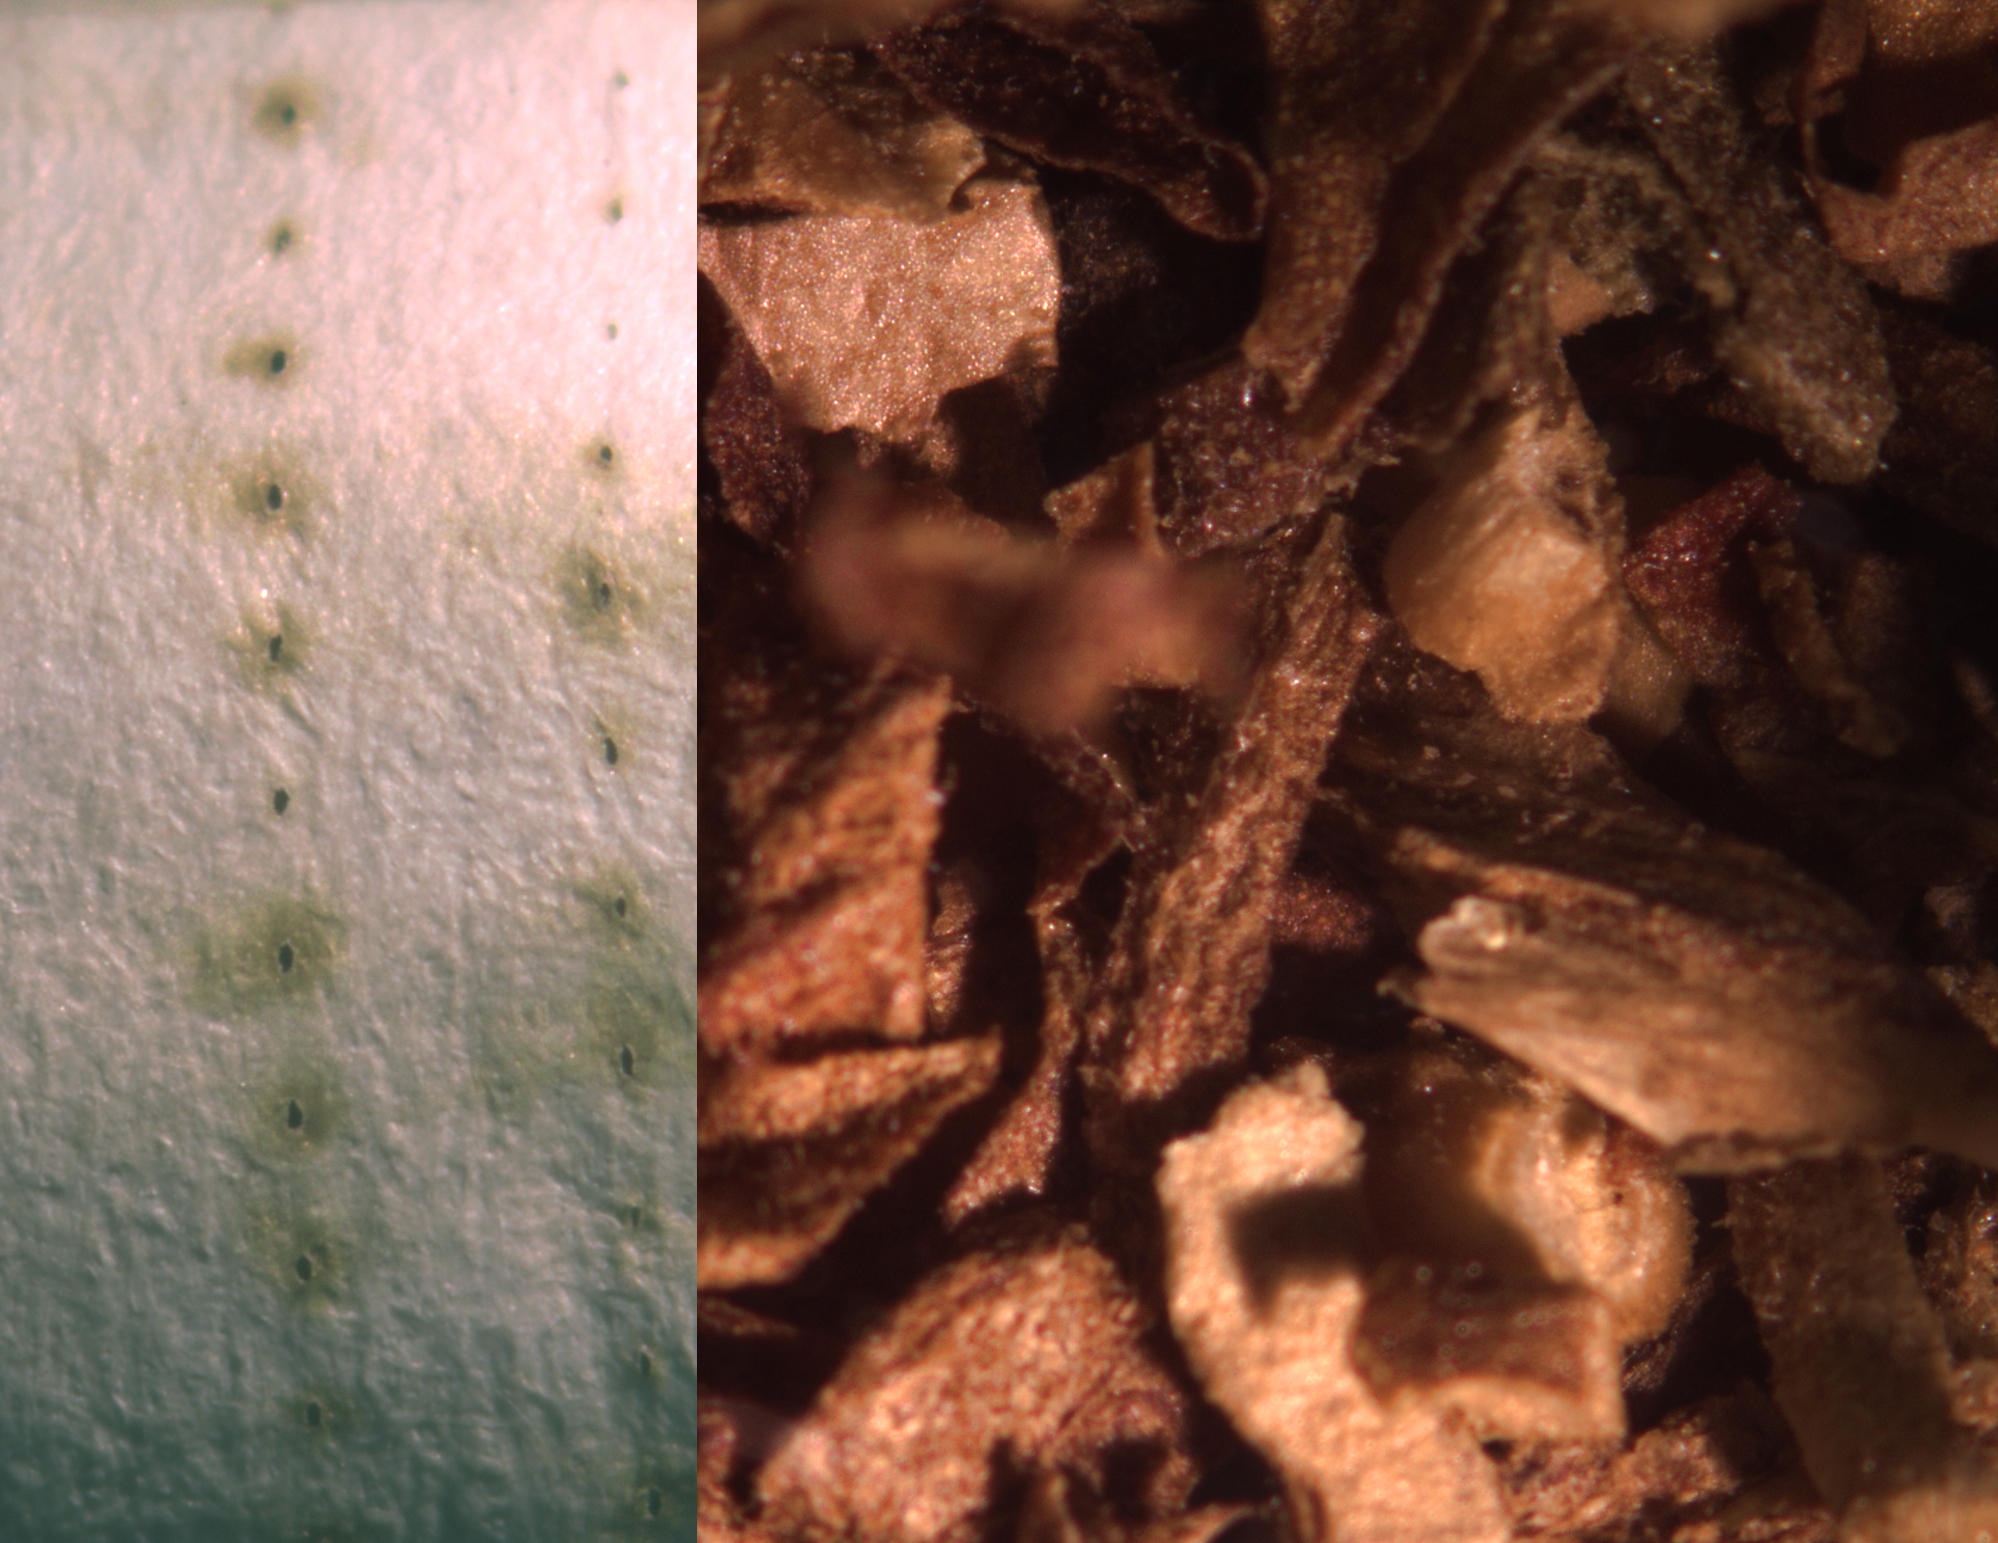
Macro Imaging
Filter and tobacco from suspect cigarettes.
Courtesy of Dr. Webber, Wadsworth Center, Albany, NY
 [12]
[12]
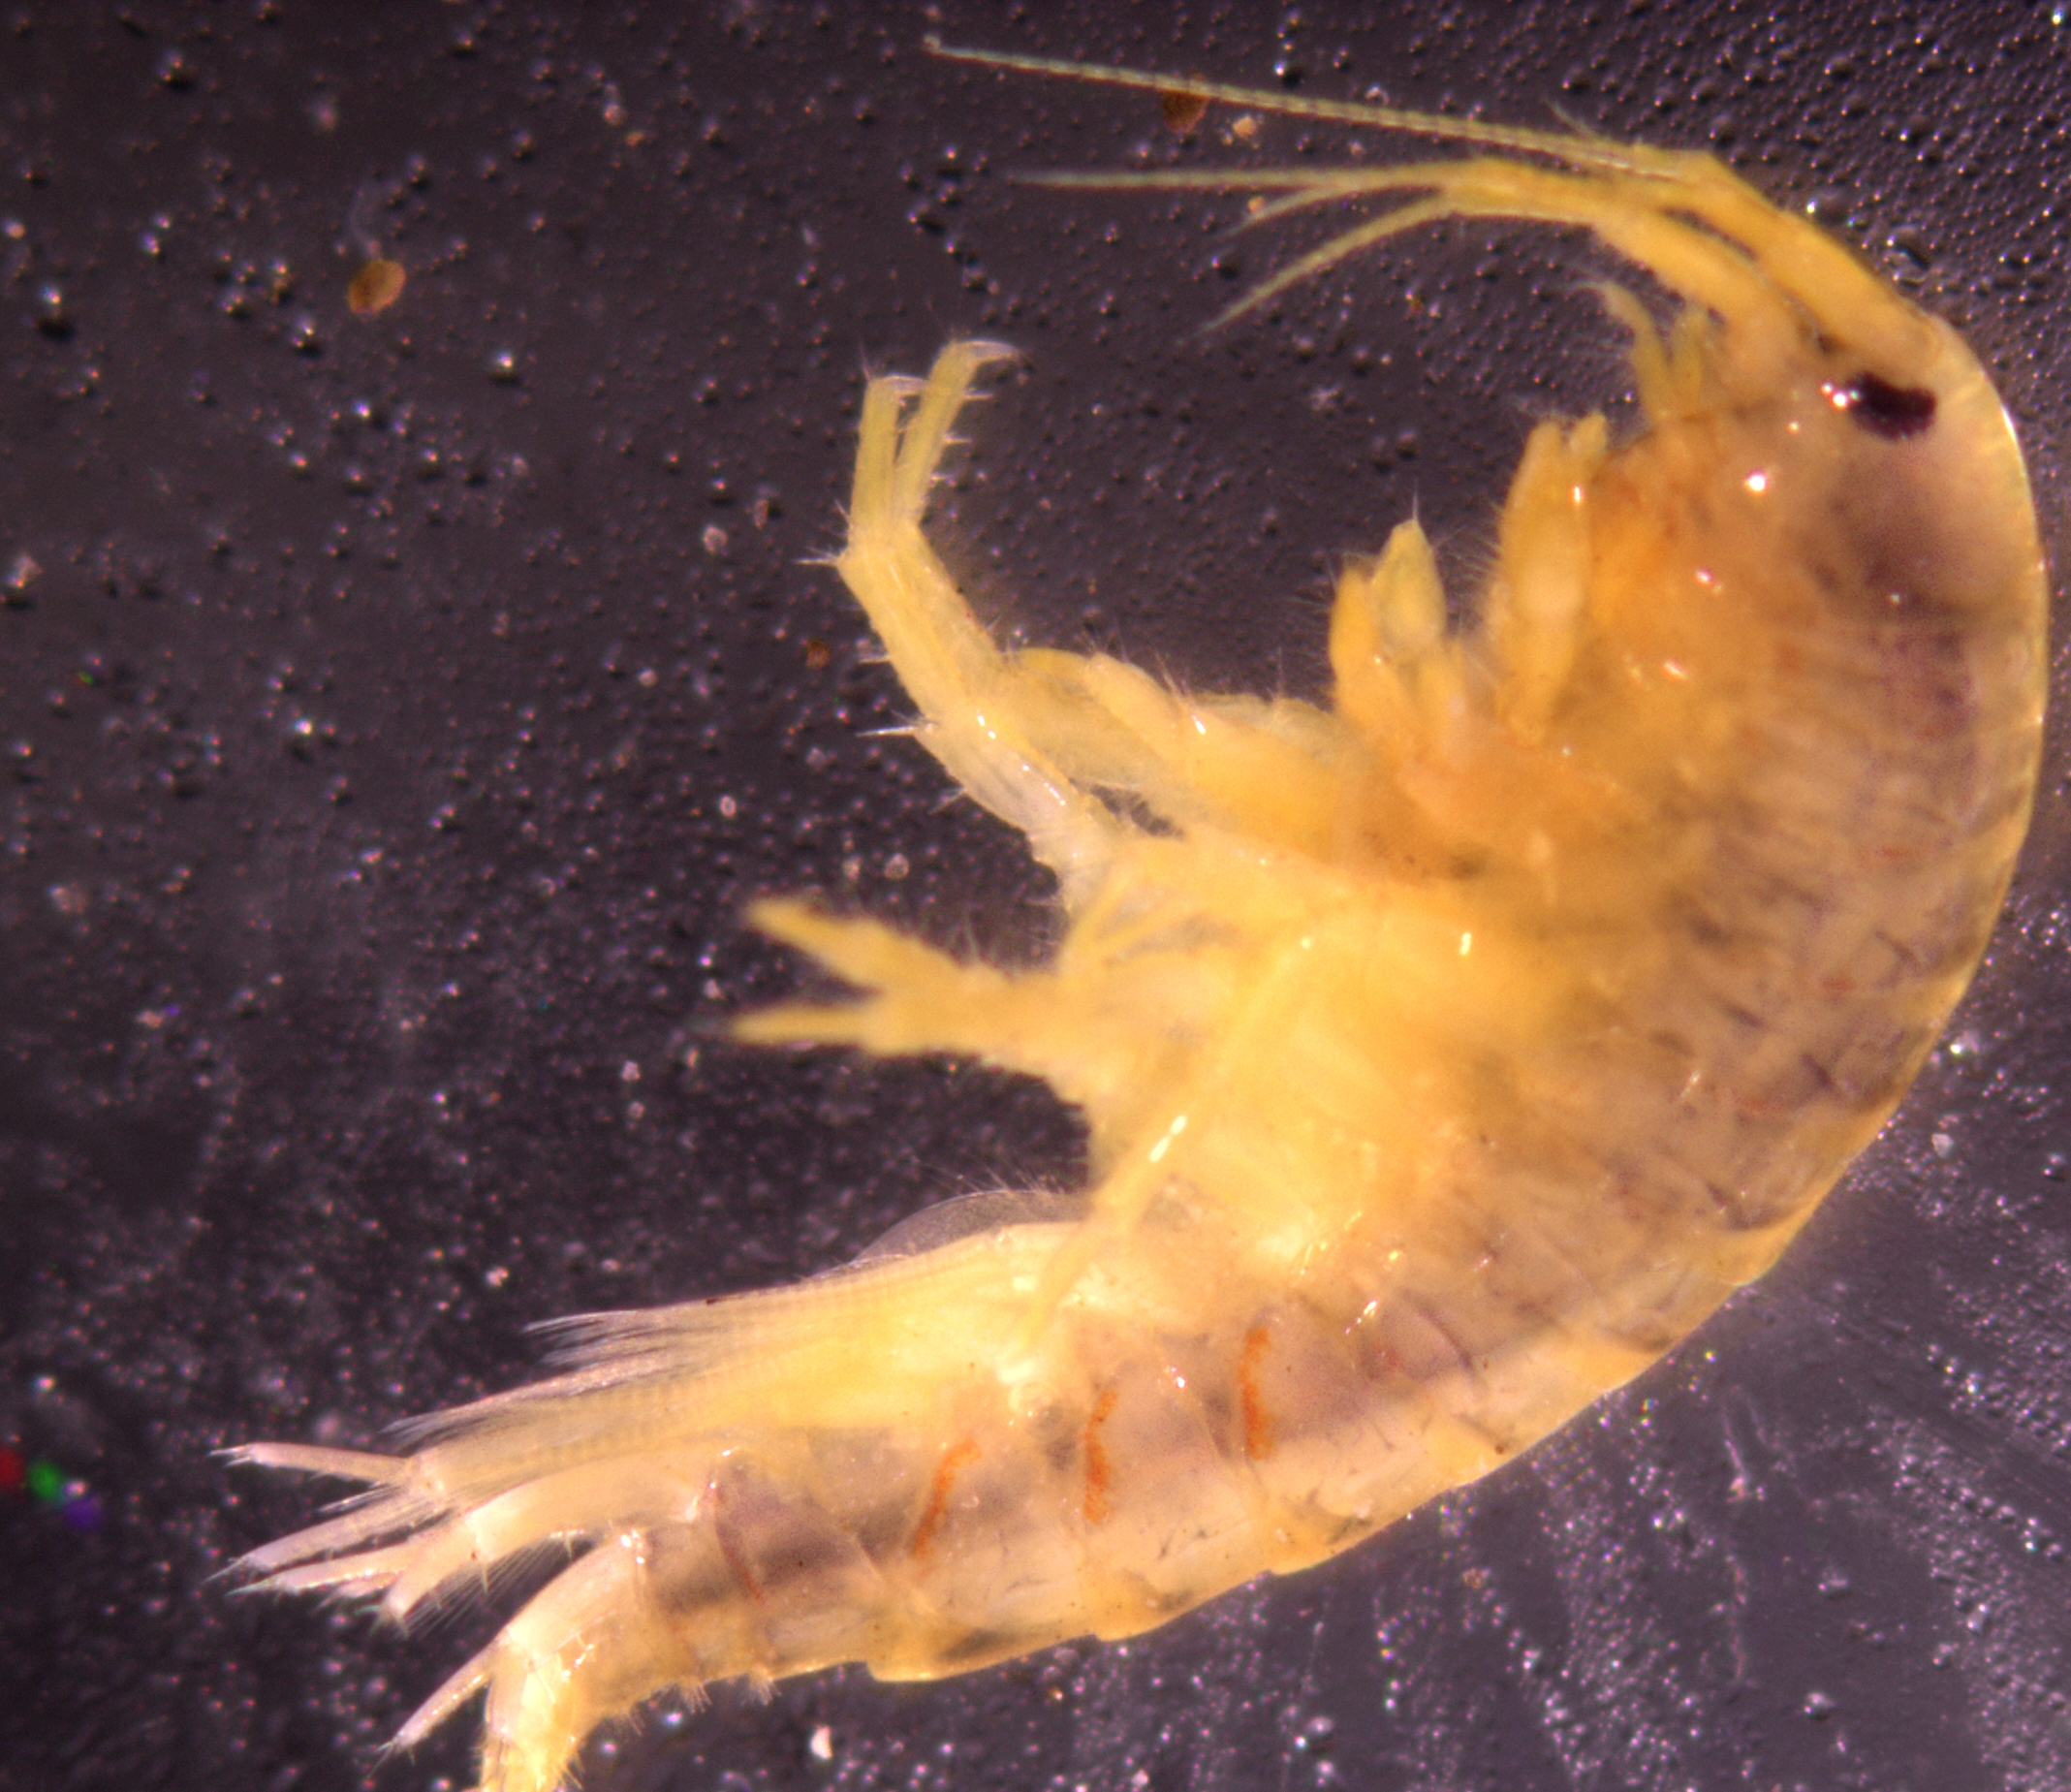
Macro Imaging
Freshwater shrimp from water supply.
Courtesy of Dr. Braun-Howland, Wadsworth Center, Albany, NY
 [13]
[13]
FRAP
Photo bleached spot in a lipid bi-layer and the subsequent diffusion into the bleached area. The recovery after bleaching demonstrates the fluid nature of the bi-layer. (Bar=30 µM, time in minutes)
Courtesy of Dr. Kane, RPI, Troy, NY
 [14]
[14]
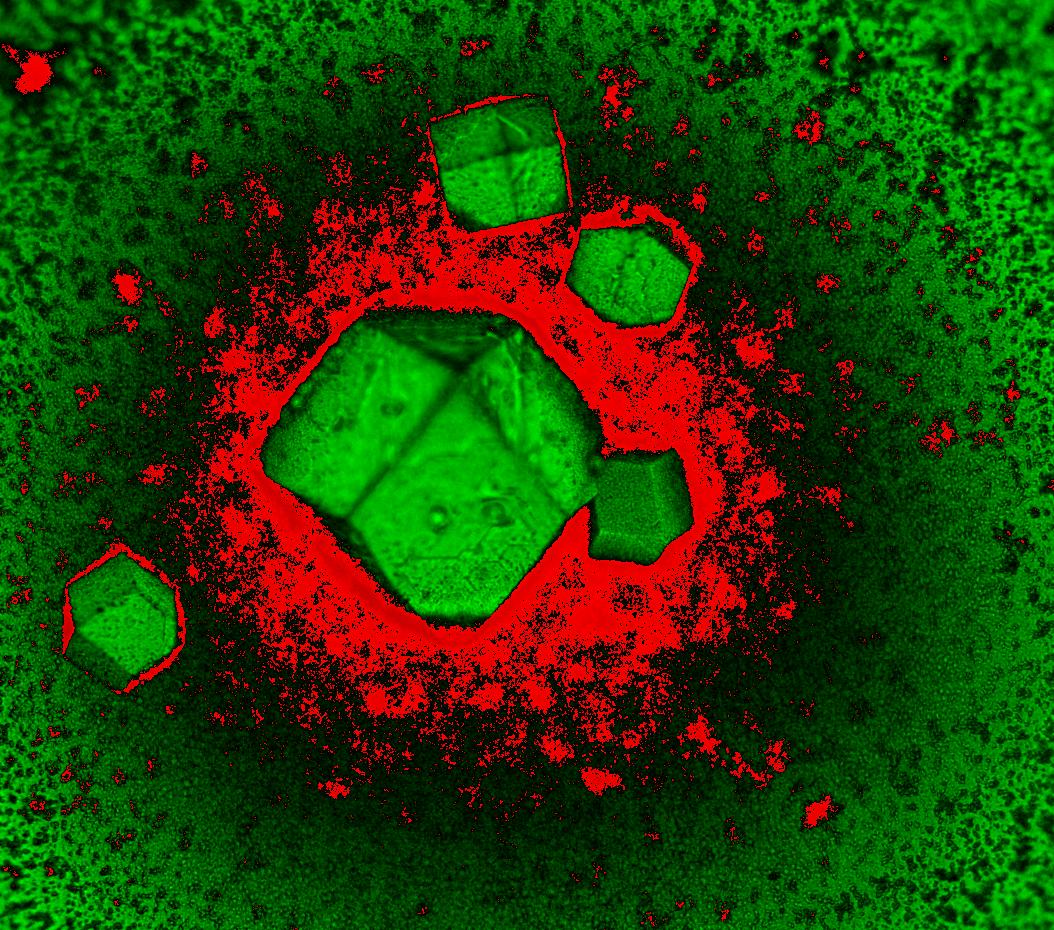
Opaque Objects
Pseudo colored crystal of Mycoplasma arthritidis mitogen.
Courtesy of Dr. Li, Wadsworth Center, Albany, NY
 [15]
[15]
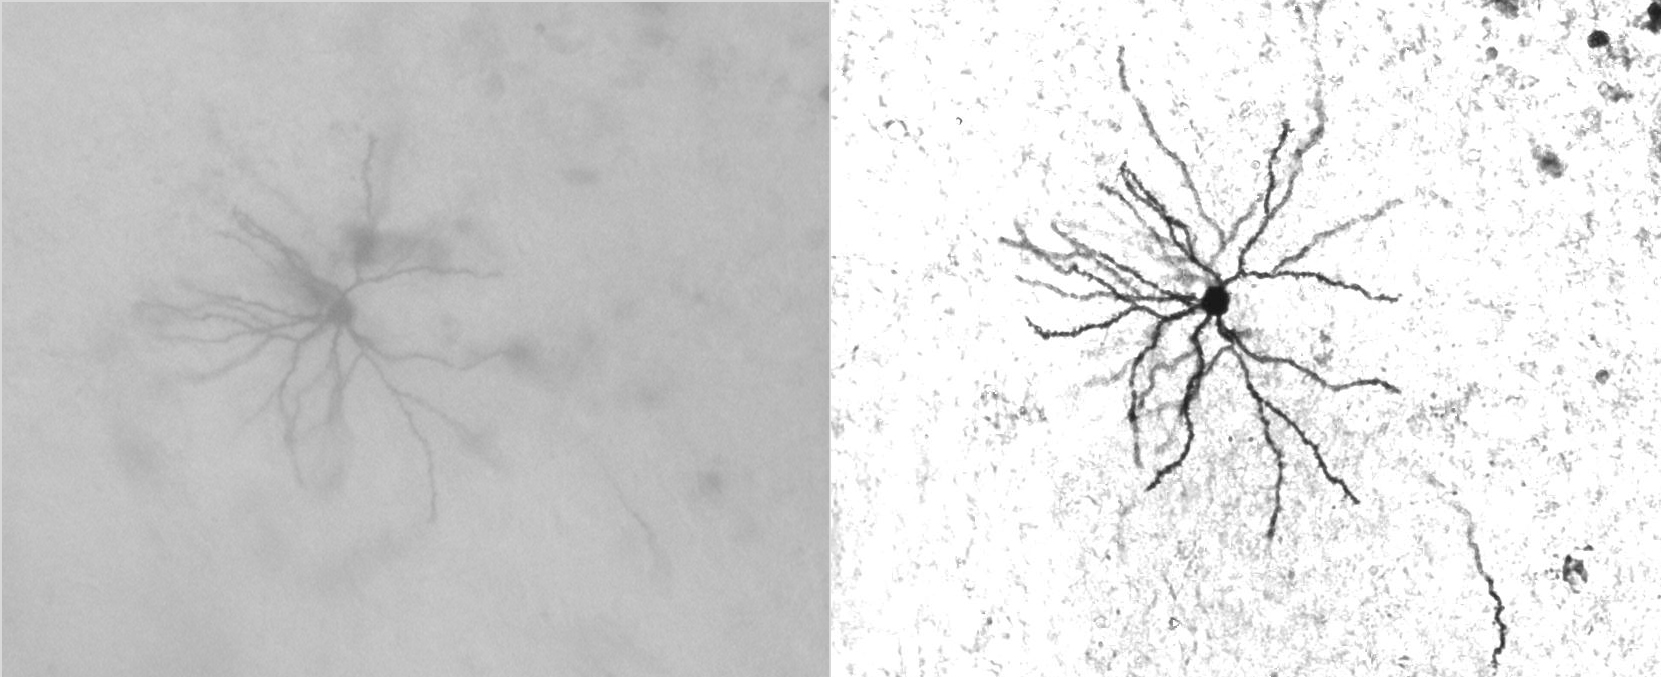
Benefit of Deconvolution Bright Field Imaging
Neuron imaged in bright field mode (left) and the same neuron after deconvolution (right).
Courtesy of Dr. Synder, Wadsworth Center, Albany, NY

