Principal Investigator: Rajendra K. Agrawal, Ph.D.
Protein synthesis (or translation) is a fundamental process in all forms of life. An understanding of the molecular mechanisms underlying the various steps of translation is of seminal importance in a large range of fields in Biology.
We study the structure and function of ribosome, the protein synthesizing machinery of the cell and cellular organelles such as mitochondria, using cryo-EM single-particle reconstruction techniques (Frank et al., 2000; Shaikh at al., 2008). The current focus in the Agrawal laboratory is to structurally characterize the mammalian mitochondrial translation by studying molecular interactions between the mitochondrial ribosome and its ligands during all steps of protein synthesis, at 5-8 Å resolution in each case. The goal is to come to an understanding of (i) the unique features of the organellar ribosmes in general, and mitochondrial ribosomes in particular, as molecular machines, and (ii) their structural evolution from the primitive endosymbiotic bacteria, over the course of 2 billion years, to its current form within the mitochondrion of various cell types/organisms.
Cryo-EM single-particle reconstruction has evolved to become the most powerful approach to study ligand binding and conformational changes accompanying translation. Recent reviews (Agrawal et al., 2011, Agrawal and Sharma, 2012; Frank, 2012) gives only a glimpse of many results that have accumulated since 1996, when tRNA binding to the ribosome was first visualized (Agrawal et al., 1996). The EF-G mediated tRNA translocation was also first visualized by cryo-EM (Agrawal et al., 1998; 1999; Frank and Agrawal, 2000), and then main sequence of events during the translation elongation cycle were visualized (Agrawal et al., 2000). These early studies laid much of the groundwork for several functional ligand-binding studies that subsequently followed during the past decade in the Agrawal laboratory and many other laboratories. The Agrawal laboratory obtained the first cryo-EM structures of (i) the mammalian mitochondrial ribosome (Sharma et al., 2003), (ii) chloroplast ribosome (Sharma et al., 2007), and (iii) a protistan mitochondrial ribosome (Sharma et al., 2009). These studies revealed several unique features of the organellar translational machinery as reviewed recently (Agrawal and Sharma, 2012; Agrawal et al., 2011). In addition, the Agrawal laboratory continues to study specific steps of cytoplasmic translation, for example, RRF- and EF-G-dependent ribosome recycling (Agrawal et al., 2004; Barat et al., 2007; Yokoyama et al., 2012), in order to understand the underlying molecular mechanisms of the process and to compare the analogous mechanisms in the mitochondrial system. Using existing tools of cryo-EM single-particle reconstruction, and tools being developed for time-resolved cryo-EM studies (e.g., Lu et al., 2009), we are pursuing studies to unravel detailed molecular mechanism of various steps of mammalian mitochondrial translation at 5-8 Å resolution. Here are examples from some of the more recently published works:

Figure 1. Comparison between the segmented cryo-EM maps of ribosomes from (A) bacteria (70S, E. coli), (B) chloroplasts (70S, Spinacea oleracea), (C) protistan mitochondria (50S, Leishmania tarentolae), and (D) mammalian mitochondria (55S, Bos taurus). Ribosomal Proteins of small and large ribosomal subunits are colored yellow and blue, respectively, while ribosomal RNAs are colored orange and magenta, respectively. Results revealed that mitochondrial ribosome surfaces are shielded extensively by protein masses. (E, F) Secondary structures of small and large ribosomal subunit RNAs, respectively, from bacteria (grey), mammalian mitochondria (green), and L. tarentolae mitochondria (red). Structures of mitochondrial rRNAs were derived from analyses of respective cryo-EM maps.

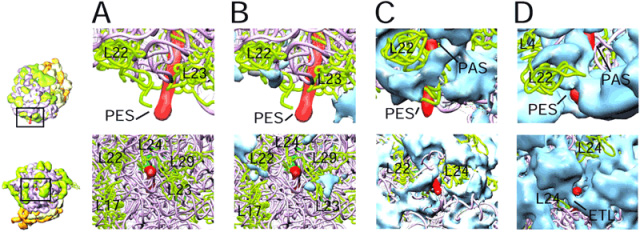
Figure 2. A side-by-side comparison of topographies of the nascent polypeptide-exit sites in 3D cryo-electron microscopic maps of the ribosome from (A) bacteria (E. coli), (B) chloroplasts (S. oleracea), (C) protozoan (L. tarentolae) mitochondria, and (D) mammalian (B. taurus) mitochondria, suggesting that the mechanism of nascent polypeptide (red) exit in mitochondria is dramatically different from those in bacteria and chloroplasts. Pink and green are conserved rRNAs and proteins, respectively. Solid blue masses represent organelle specific protein masses.

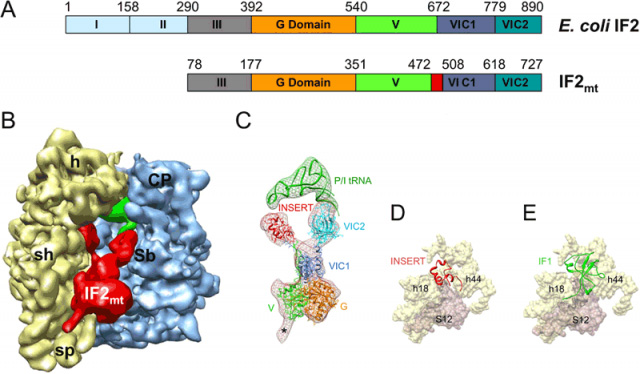
Figure 3. Structure of the mammalian mitochondrial translation initiation factor 2 (IF2mt) as derived by single-particle cryo-EM, and location of its mitochondrial-specific insertion domain relative to the binding site of bacterial IF1. (A) Domain alignment of E. coli IF2 and bovine IF2mt. The mature IF2mt (i.e., after deletion of the mitochondrial import sequence) starts from aa residue 78. The 37-aa insertion domain in IF2mt is highlighted in red. (B) The cryo-EM map of the E. coli 70S ribosome (30S subunit, yellow; 50S subunit, blue) in complex with IF2mt (red), initiator tRNA (green) at the P/I position (P/I stands for P-site tRNA at the initiator position). (C) Fitting of atomic models of the IF2mt and initiator tRNA into the corresponding cryo-EM densities (meshwork) extracted from the map shown in panel (B). The color codes used for various domains of IF2mt are the same as in panel A. Asterisk (*) point to the region that would correspond to domain III of IF2mt but was not modeled. (D) Binding positions of the insertion domain (red), and (E) IF1 (green), into a common binding pocket on the SSU of the ribosome. Components of the binding pocket on SSU, the 16S ribosomal RNA helices (h18 and h44) and ribosomal protein S12, are identified.

Figure 4. Segmented cryo-EM maps of the bacterial 70S ribosome post-termination complex (PoTC) in complex with ttRRF and in complex with ttRRF and EF-G. (A) The PoTC•ttRRF complex. The 70S ribosome (yellow, 30S subunit; and blue, 50S subunit), with ttRRF (red); (B) The PoTC•ttRRF•EF-G•GDP•FA complex, shown in a matching view as in panel A. Densities for both ttRRF (red) and ecEF-G (orange) are readily identifiable. Position occupied by domain II of ttRRF in panels A is now occupied by domain V of EF-G. In both complexes density corresponding to mRNA (dark blue) can also be seen. (C) Molecular interactions between the ribosome and ttRRF in the PoTC•ttRRF complex. (D) Molecular interactions between ttRRF and EF-G within the PoTC•ttRRF•EF-G•GDP•FA complex. Thumbnails to the lower left of panel C and lower right of panel D depict overall orientations of the ribosome in those panels.